
Driving Future Business
Business environments are changing rapidly and many companies are applying digital technologies to their operations to help them meet customer expectations and stay competitive in the face of emerging new business models. These operational changes, coupled with increasing accountability and growing regulatory oversight, have added new requirements onto already over-stretched Finance functions.
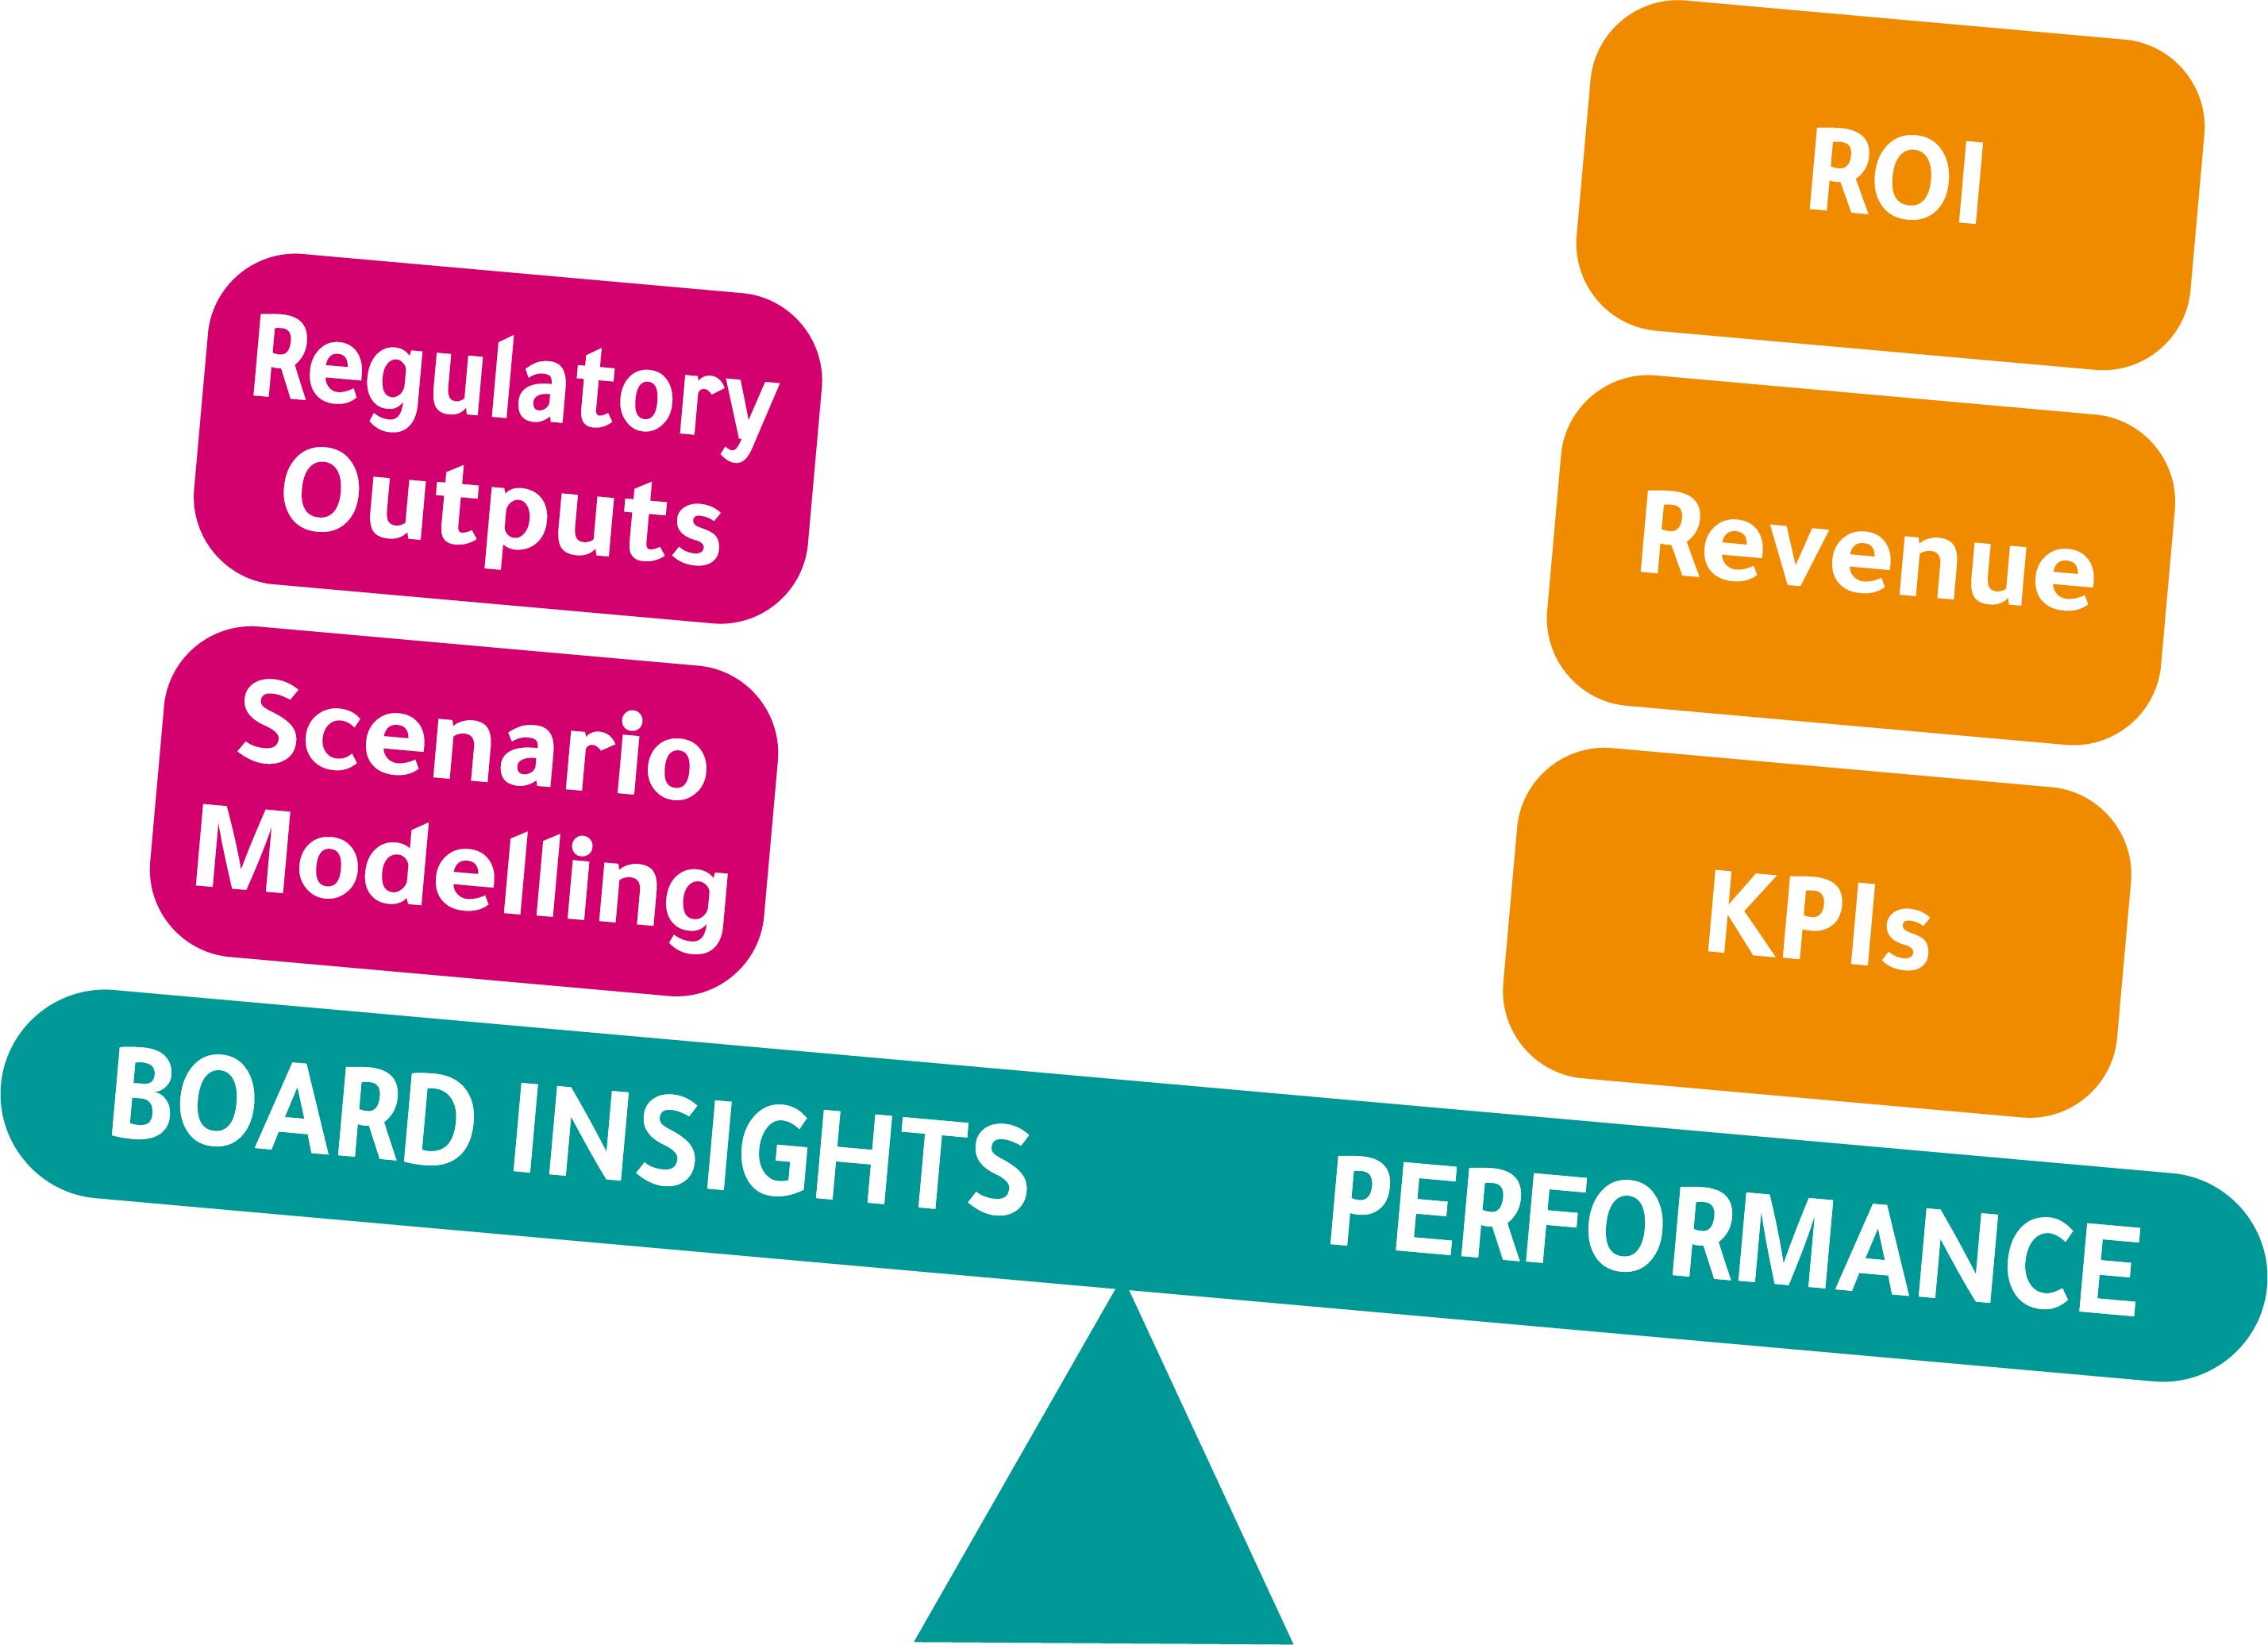
Change, Complexity, Heightened Demands
- Executives want better and faster insights
- New business opportunities need to be modelled
- Operational changes also impact financial reports
- Regulators want further break down of numbers
- KPIs such as revenue and ROI need to be evaluated
- Operational managers want performance insights
To compound the problem, newly digitised operations are generating more data than ever (such as sales orders, supply chain stats, customer demand) all of which adds further complexity to finance analysis and reporting.
The future is available now – ORYX 2019
Clients typically engage us when they are having problems with process such as consolidations, eliminations, allocations, revenue recognition, etc. Common issues are: overly complex spreadsheets, large data volumes, or sometimes simpler things like the data not reconciling.
Each engagement provides valuable input for the ORYX roadmap and enables us to keep developments focused on real-world priorities. Whilst analysts recognise ORYX as possessing AI (Artificial Intelligence) capability, the reality at this point is that most finance functions are focused on the basics – they need to make planning and period-end close processes quicker; and they need to provide better insights for managers.
This feedback enabled us to focus our roadmap and get the right themes for the ORYX 2019 release:
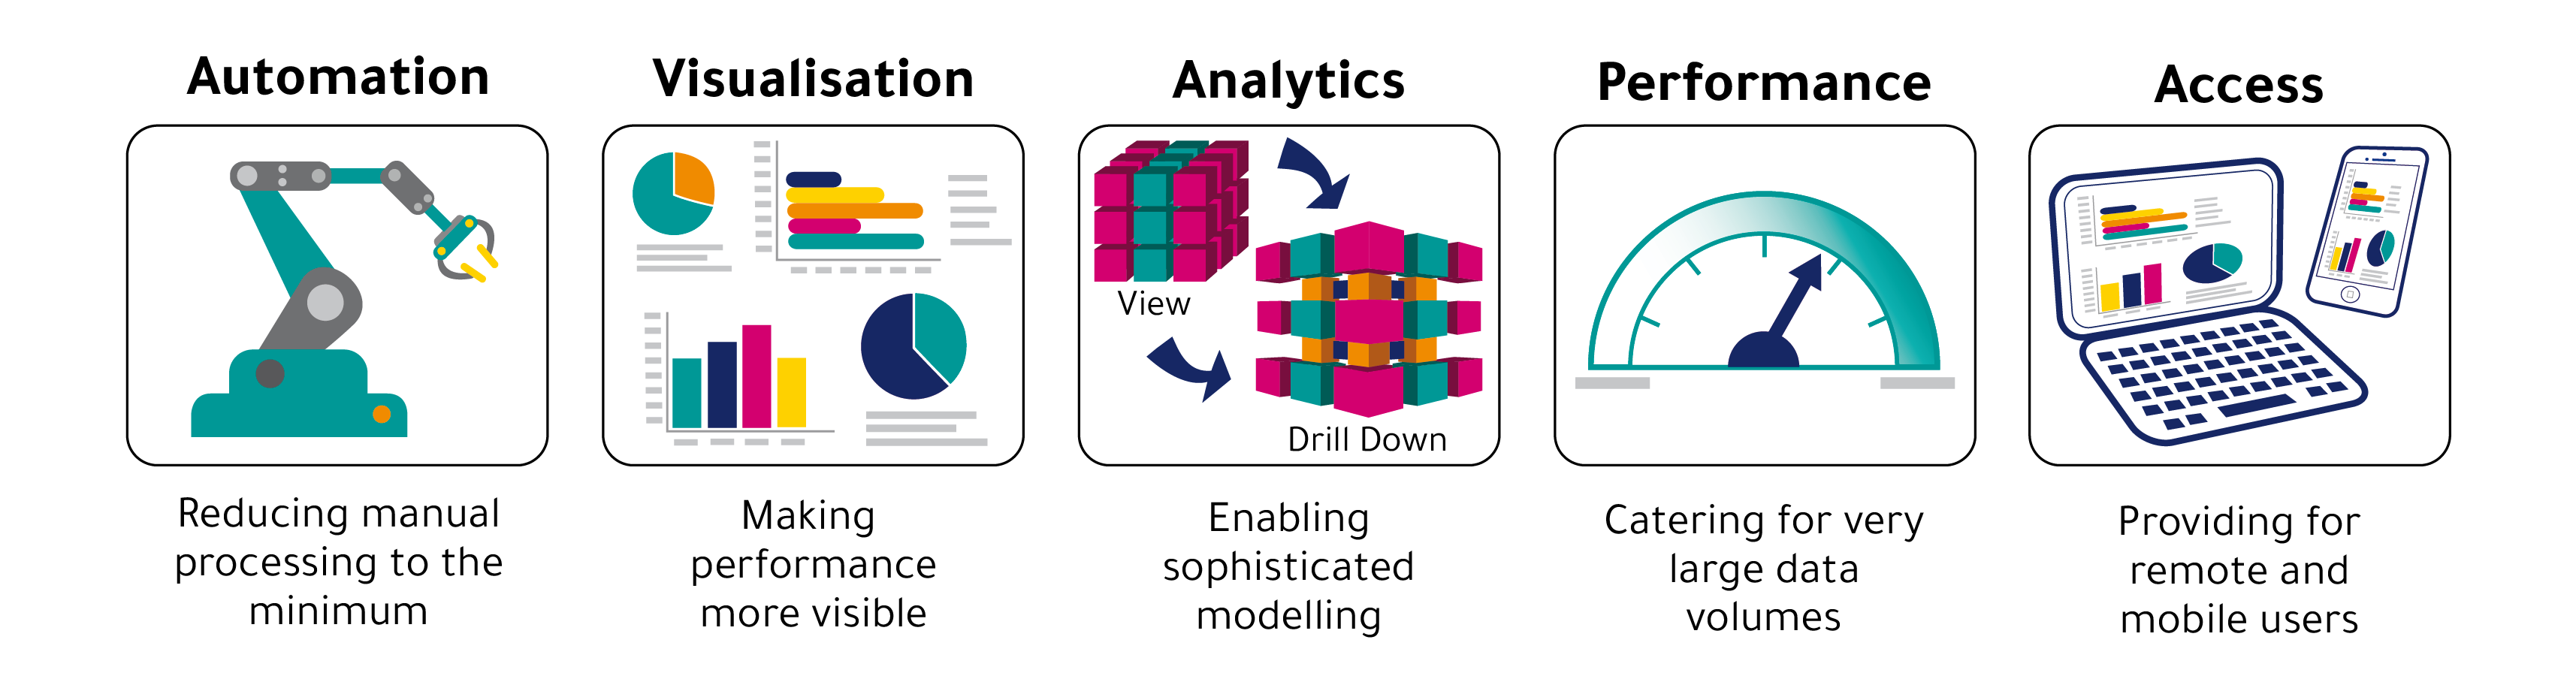
Automation
Much of the published analysis shows a significant percentage of finance staff time being spent on things that could be automated including tasks like:
- Extracting of data from source systems
- Loading of data into analysis tools like ORYX
- Validations (checks for missing data, auto-fixing of known issues, format corrections)
- Mapping (linking data to business drivers, rolling values up)
- Production of basic reports (income statement, balance sheet and cash flow)
Some of the remaining tasks are semi-automatable; but variance analysis and scenario modelling will probably retain manual elements, due to the degree of interpretation and business knowledge needed – but we will be adding in further AI capabilities into these areas in the future.
The automation functionality we have included in ORYX 2019 includes:
- Data validation tools to detect and auto-fix issues (or alert users)
- Workflow tools to enable the full end-to-end process to be automated and done by users through the assignment of tasks
- Collaboration tools that enable users to communicate and share information – for example: highlight a potential error, request a review
Visualisation
Many clients ask about dashboards and visualisation of results to give operational managers and end users a better understanding of the performance trends hidden in their data.
ORYX 2019 now contains comprehensive dashboards that can illustrate data in many formats:
- Key performance indicators (KPIs)
- Interactive graphs and charts with live data from any source
- Ability to drill through from a dashboard to the underlying data
ORYX dashboards are completely customisable and so can be setup to meet specific needs and show the precise performance information required.
Analytics & reporting
Managers are demanding not just visualisation but greater insight from business data to help them see their operational performance. Some clients we talk to have access to ‘data lakes’ that hold vast amounts of raw data that can be used to create outputs.
To support this we have improved the analysis tools in ORYX to include the following:
- Scenario modelling so the sensitivity and impact of key parameter changes can be explored (e.g. FX rates, demand and supply assumptions)
- Reporting that is flexible and can mimic any structure (e.g. GAAP, IFRS) and can be output in any standard format
- Cube views to support dimension driven analysis and enable slice dice and drill down from top level to the contributing transactions
- Direct cube to cube comparisons to enable easy assessment of differences
Processing speed
Finance are having to process more data than ever before and so to support this we have improved our data handling capabilities in several ways:
- Providing cloud hosted solutions with elastically scalable storage and processing
- Creating in-memory data storage that removes the need for time-consuming access to/from disks and databases
- Optimising how computations operate on the data to speed the processing
We will continue to improve performance of ORYX, as new techniques and technologies permit.
Access
We have seen an increasing demand for remote access into ORYX to support users who are mobile or offsite. The most typical example has been managers away from the office, who need to review and approve outputs.
To support this we have equipped ORYX with web access to enable remote entry and approvals.
2020 Vision
We have laid out the key themes of our future vision in ORYX 2019, and future developments will follow this lead. In parallel, the vision for digital finance is also getting clearer; organisations are moving ahead with operational transformations and, although the outlook seems to be “more change”, some future trends are clear:
- Continued pressure to automate manual tasks
- Rapid increase in data volumes
- Broadening applications for AI and Machine learning (ML)
But, for all the benefits of digital technologies, nothing can resolve bad or missing data; and so we envisage leading organisations will enforce better data governance and processes. Those that achieve it will be able to maximise their use of automation technologies like ORYX.